I am happy
to inform that 23andme has got repaired a few weird things I noticed two weeks ago. Two Finns owning obviously non-Finnish
European admixture show now sensible results.
The first one shows now 37% Finnish, being before the repair 100%
Finnish. A huge difference. The second
Finn shows now 47,9%, was earlier 99.9% Finnish. I was not cheating.
What’s new
Basically Ancestry Composition is unchanged, only the software engine behind the user interface is revised. Now it is
time to go ahead and look at new results.
I have made some statistics. The
first graphics shows results per country,
how well 23andme has succeeded to assign people to their own national gene
pool. It was of course no sense to select national
groups without own reference group, like Estonians. They look “mixed” despite of the genetic diversity
level.
All Finns
with known recent foreign admix are excluded as well as Swedish speaking
citizens, but of course I can’t know what happened hundreds years ago. I can’t guarantee that all Finns are same
people from the ice age and not even from the Roman Iron Age. The Balts includes Lithianians and Latvians.The Russian group includes only ethnic Russians.
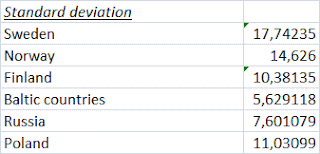
Secondly we
see the standard deviation of results of each country. It is good to notice that even in case the
national proportion is very low, like in the case of Scandinavians, the deviation
in own gene pool figures population diversity comparable to averagely higher
country numbers. This is one of those
weird things being related to admix analyses and sometimes mislead people to
think that admix analyses showing plenty of admixes means high diversity. Actually it is a wrong conclusion. Admixture results show only how much some
corresponding part of your genome resembles the chosen reference set.
Finnish
results
Looking at results and the origin of Finns we can be sure that 23andme uses Finns from the
late settlements in building the Finnish reference set. The
term late settlement is used by Finnish historians and means areas which were
mostly populated during the Swedish era by administrative transactions (king’s
orders) or by occupying areas in wars between Sweden and Novgorod/ later Moscow. This
means actually that the age of Finnish reference group is around 500-700 years
and people living in older settlements, in areas that where populated pretty
much before Swedish crusades to Finland, are compared to them, not vice versa. It is
impossible to find out how much genes have during this 500-700 years period
moved from old settlements to late settlements and how much from late
settlements to old settlements, but we know the age of both populations . The younger entity can’t be used to classify
the older one. Who populated the late
settlements in Finland is another question.
Anyway, evaluating
the error caused by this poor test arrangement and putting things newly
together we could try to estimate the lowest percentage for unmixed Finns by looking the Finnish history and personal data at 23andme. It would be at lowest level around 70%, being
somewhat below that in Southwestern Finland because they have given least genes to
the late settlements, less than Tavastians, Karelians and Ostrobothnians. In
SW-Finland a bigger portion of old Finnish heritage remains unknown and hides
inside nonspecific numbers. You can notice this, as well as the Swedish
admix level, just look at your shared Finnish results at Ancestry
Composition. The Finnish percentage being smaller than 70% we
can expect some foreign admix more than the corresponding average Finnish admixture
for example in Sweden and Russia.
Highest Finnish numbers seem to be from East Finland, near Iisalmi and Kuopio, highest in East Europe from Baltic countries, Pskov and Tverskaya regions in Russia and the highest Scandinavian number is from Värmland (Sic!), Sweden, followed by Norwegians nearby the Värmland on the other side of the boundary between Norway and Sweden. I wouldn't say I felt any déjà vu when looking these results, it is boring to see how admix analyses do this again. Must say, we need now new ideas. Although 23andme uses obviously their own dedicated admix model they still fall into the same problem than all recent admix models deriving results based on a pure admix model and don't taking into account genetic drift. Unfortunately admix models conclude that the gene flow goes always from homogeneous populations to more heterogeneous one, without understanding the effect of genetic drift which happens usually after opposite gene flow. This happens because admix models don’t take into account timelines and believe that higher diversity is an admixture of present-day populations.


No comments:
Post a Comment
English preferred, because readers are international.
No more Anonymous posts.